"Portfolio" window
To display the portfolio, go to the "Trading" menu and select "Portfolio".
- The upper part of the window displays global information about your portfolio.
- The lower part displays information about your currently open positions and positions closed during the current day (greyed out lines).
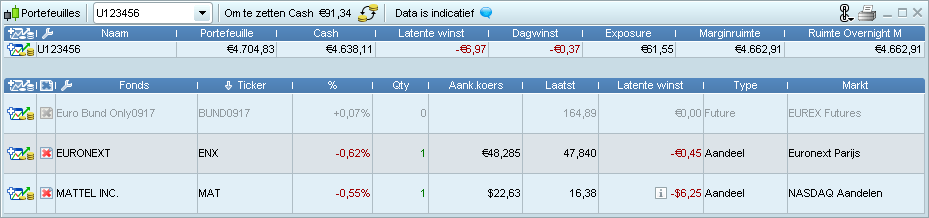
If you have more than one portfolio linked to your ProRealTime platform, the dropdown menu lets you go from one to another.
| Column | Description |
|---|---|

|
Opens the detailed report of your trading performance for the whole portfolio |
| Name | ProRealTime trading account number |
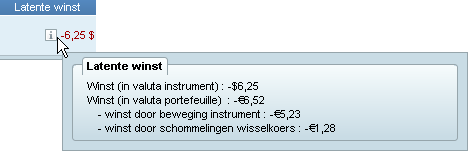
| Portfolio | Amount in your portfolio, with any latent gains and losses of open possitions added to it. This information is also displayed at the top of the charts. If you have positions in several currencies, or if you have liquidity in multiple currencies ("cash to be converted"), this amount is converted in real-time into the base currency of your portfolio, using the current currency conversion rate to calculate portfolio the amount in this column. Note that if you have "cash to be converted" in other currencies, the value of your portfolio may vary from day to day even if you have no open position - Here is an example.
|
| Liquidity | Liquidity available in your portfolio from an accounting perspective. This information is calculated by adding your "cash", the value of your short selling positions on securities and any latent gains or losses on derivatives. Note that this information may be different from your liquidity available for trading, notably if you have open positions. |
| Gain today | Cumulative gain or loss since the beginning of the day of all of your positions (open and closed), without taking into account any brokerage fees. To learn more see the section "Gain Today". |
| Latent gain | Latent gain or loss of all of your open positions, without taking brokerage fees into account. To learn more, see the Latent Gain" section. |
| +/- Stocks, +/- Forex, +/- Futures ... |
Latent Gain or loss of your positions per instrument type, without taking brokerage fees into account. |
| Avail Margin | Available funds to keep your positions open. |
| Avail Initial M | Available funds to open new positions |
| Avail Overnight M | Projection of funds available to keep your positions open overnight. |
| Avail OV Init M | Projection of funds to open new positions overnight. |
| Exposition | Total value of your open positions. Example :
|
| Stock exposure Forex Exposure, Exposition Future, ... |
Value of open positions per instrument type. |
| The base courrency is the euro. | Base currency of your portfolio. |
| Column | Description |
|---|---|
 |
Opens the chart of the instrument in a new window. |

|
Close position |
|
|
Opens the detailed report of your performance on this instrument |
 |
Opens the equity curve of your gains and losses on this instrument |
 |
For "Options" type instruments, opens the option pricer window. |
| Name | Complete instrument name |
| Code | Code or "Ticker" of the instrument. |
| ISIN | ISIN code of the instrument |
| Market | Market or exchange the instrument is traded on |
| Type | Type of instrument (Stock, Future, ETF, Forex, ...). |
| Qty | Position quantity |
| Unit cost | Average unit cost of each instrument - Example
|
| Total cost | Total position cost. This information is available for instruments like stocks and ETFs. Its calculated as : [Average cost] X [Position quantity]. |
| Latent gain1 | Latent gain Latent Gain" section. |
| %Latent P1 | Latent profit or loss in % of the position. |
| Gain today1 | Cumulated gain or loss since the beginning of the day of all your positions (open and closed) on this instrument, without taking into account brokerage fees. To learn more, see the section "Gain Today". |
| Pending buy | Number of pending buy orders on this instrument |
| Pending sell | Number of pending sell orders on the instrument |
| Prev | Previous day's close of the instrument |
| Last | Last price of the instrument |
| %Var | Variation % from yesteray's close. |
| Exposition | Position value |
| Today buy | Total quantity bought today for this instrument |
| Today sell | Total quantity sold today for this instrument |
| Ask | Best ask price in the order book |
| Bid | Best bid price in the order book |
Cash to be converted
Refer to the section multiple currency account to learn more.